I Hired a Platform Engineer Who Can’t Break Anything
Onboarding an AI agent onto my cloud with 15 tools, viewer-only credentials, and no path to production
Every on-call engineer knows the loop. An alert fires. You open the logs console, guess a filter, scroll. You switch to the metrics console, remember the exact metric type for container CPU, pick an aligner. You switch to Error Reporting to see whether this is new or has been quietly failing for a week. Twenty minutes in, you have five browser tabs and a partial theory.
The strange thing is that none of that is hard work. It’s joining work — correlate this log spike with that deploy, with that memory metric, with that error group’s first-seen timestamp. It’s exactly the kind of work a language model is good at, and exactly the kind of work it can’t do, because it can’t see any of it.
The Model Context Protocol (MCP) fixes the “can’t see” part. So I onboarded one: an MCP server that gives an agent the read access a platform engineer gets on day one — logs, metrics, error groups, alert policies, resource inventory, spend, and cost recommendations. Fifteen tools. Not one of them can change anything.
It’s the hire you’d never regret making. It reads everything, correlates across four APIs without complaining, and cannot take production down, because I never gave it the ability to.
This is a walkthrough of the implementation, including the decisions I’d defend and the bugs that were only obvious in hindsight.
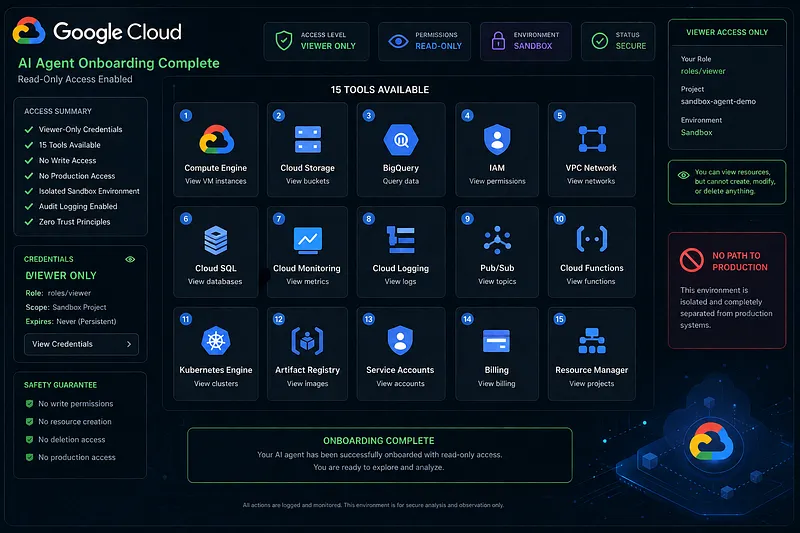
The one constraint that shaped everything
I decided up front: no mutating tools. Ever.
Not “mutating tools behind a confirmation prompt.” Not “mutating tools in a later phase, flag-gated.” None. An agent with a restart_service tool is a fundamentally different risk object than an agent with query_logs, and I wanted the second thing before I even thought about the first.
This constraint is what made the project shippable in an afternoon rather than a quarter. There’s no approval flow, no audit log of actions taken, no dry-run mode, no rollback story, no “are you sure” that a model can talk its way past. The set of things that can go wrong shrinks to: it reads something it shouldn’t, or it reads too much and burns tokens.
The important part is that I don’t rely on my own code to enforce this. More on that below — it’s the section most people get wrong.
Architecture: boring on purpose
The whole server is about 700 lines of Python across eight files.
src/platform_mcp/
├── server.py        # FastMCP instance + tool registration
├── config.py        # project resolution, defaults
├── clients.py       # lazy, cached, credential-aware GCP clients
├── formatting.py    # payload condensing helpers
└── tools/
    ├── logging_tools.py           # query_logs, get_recent_errors
    ├── error_reporting_tools.py   # list_error_groups
    ├── monitoring_tools.py        # query_metric, list_alert_policies, list_uptime_checks
    ├── recommender_tools.py       # list_cost_recommendations, list_recommendations
    ├── cost_tools.py              # get_cost_breakdown, get_billing_info
    └── inventory_tools.py         # search_assets + 4 typed shortcuts
server.py is the entire wiring layer:
from mcp.server.fastmcp import FastMCP
from .tools import (
    cost_tools, error_reporting_tools, inventory_tools,
    logging_tools, monitoring_tools, recommender_tools,
)
mcp = FastMCP("platform-mcp")
for module in (
    logging_tools, error_reporting_tools, monitoring_tools,
    recommender_tools, cost_tools, inventory_tools,
):
    module.register(mcp)

def main() -> None:
    mcp.run()
Each tool module exposes a register(mcp) function that calls mcp.tool() on its plain functions. That’s the only convention in the codebase. Adding a domain means adding a file and one line to a tuple.
FastMCP does something genuinely useful here: it derives the tool schema from the Python signature and the docstring. So this function —
def query_logs(filter: str = "", freshness: str = "1h", limit: int = 50) -> dict:
    """Query Cloud Logging with an advanced-filter expression.Args:
        filter: Cloud Logging advanced filter (e.g. 'severity>=WARNING AND
            resource.type="cloud_run_revision"'). Leave empty to match all logs.
        freshness: How far back to look, e.g. '30m', '1h', '2d'. Default '1h'.
        limit: Maximum number of entries to return (newest first).
    """
— becomes a fully-described tool with typed parameters and no separate schema file. There’s a real lesson in this: the docstring is not documentation, it’s prompt engineering. The model chooses between fifteen tools based on nothing but these strings. Every e.g. in there was added after watching the model guess wrong. The severity>=WARNING AND resource.type="cloud_run_revision" example exists because without it, the model invented SQL-flavored filter syntax.
I used the native Google Cloud client libraries rather than raw REST. It’s more dependencies, but I get pagination, retries, and auth handling for free, and the proto types make the response shapes discoverable.
Read-only is an IAM property, not a code property
Here’s the part I want to be loud about. This is the step in onboarding where you decide what the new hire’s badge actually opens — and you don’t decide it by asking them politely not to use certain doors.
My server requests the broad cloud-platform OAuth scope:
_SCOPES = ["https://www.googleapis.com/auth/cloud-platform"]That scope permits writes. My server is read-only purely because it never calls a mutating method. That’s a property of my source code, and source code changes — by me on a bad day, by a dependency, by anyone who can influence what executes.
So the actual guarantee lives one layer down: run it as an identity that is incapable of writing. A dedicated service account with viewer roles and nothing else:
roles/viewer                 # broad read across compute, run, gke, sql
roles/logging.viewer
roles/monitoring.viewer
roles/errorreporting.viewer
roles/recommender.viewer
roles/cloudasset.viewer
roles/bigquery.dataViewer    # only for cost breakdown
roles/bigquery.jobUser       # only for cost breakdown
Now there are two independent layers. The server doesn’t try to write, and the credential couldn’t if it did. If someone slips a delete_instance tool into the codebase, it returns a 403.
And rather than downloading a key file, the server impersonates that service account:
@lru_cache(maxsize=1)
def get_credentials():
    creds, _ = google.auth.default(scopes=_SCOPES)
    target = os.environ.get("IMPERSONATE_SERVICE_ACCOUNT")
    if target:
        creds = impersonated_credentials.Credentials(
            source_credentials=creds,
            target_principal=target,
            target_scopes=_SCOPES,
        )
    return creds
Impersonation means no long-lived key material on my laptop, and every API call in the audit log carries both identities — the service account that acted and the human who authorized it.
The impersonation trap that cost me an hour
This one is worth its own paragraph because I’ve since seen other people hit it.
I set up the read-only service account. I granted my own user account roles/iam.serviceAccountTokenCreator on it. gcloud could impersonate it fine. The MCP server got a flat 403 on iam.serviceAccounts.getAccessToken.
The cause: my Application Default Credentials file was itself an impersonated-service-account credential, left over from unrelated data work. So google.auth.default() didn’t resolve to me at all — it resolved to that other service account, which had never been granted token-creator on my new one. Meanwhile gcloud kept working because the CLI uses your raw login, not the ADC file.
Two things to take from this. First, when impersonation 403s, print the resolved source identity before you touch IAM bindings — the token-creator grant you’re staring at is probably correct and irrelevant. Second, gcloud working is not evidence that ADC works. They are different credential paths, and the difference is invisible until it bites.
Token budget is a first-class design concern
Cloud APIs return enormous payloads. A single Cloud Logging entry with a full stack trace and resource labels can be several kilobytes. Fifty of them will bury a context window, and the model will have paid for every byte to find one line that mattered.
So every tool condenses. formatting.py is small and does a lot of work:
def truncate(text: Any, limit: int = 400) -> str:
    s = "" if text is None else str(text)
    s = s.strip()
    if len(s) <= limit:
        return s
    return s[: limit - 1] + "…"
def first_line(text: Any, limit: int = 300) -> str:
s = "" if text is None else str(text)
line = s.strip().splitlines()[0] if s.strip() else ""
return truncate(line, limit)Log entries collapse to five fields, and structured payloads get unwrapped to the human-readable message:
def _payload_text(entry: Any) -> str:
    payload = getattr(entry, "payload", None)
    if payload is None:
        payload = getattr(entry, "payload_json", None) or getattr(entry, "payload_pb", None)
    if isinstance(payload, dict):
        # Structured logs usually carry the human message under "message".
        msg = payload.get("message") or payload.get("msg")
        return truncate(msg if msg else payload)
    return truncate(payload)
Metric queries return at most 12 points per series and cap series count. Error groups keep only the first line of the representative message. Every list tool clamps its limit server-side:
limit = max(1, min(limit, 500))That clamp matters more than it looks. Models are optimistic about limits — asked to “check everything,” a model will happily pass limit=10000. The clamp means an over-eager request degrades into a smaller answer instead of a context blowout.
The trade-off is real: aggressive summarizing sometimes drops the field that mattered, and the model has to make a second, narrower call. I’d rather have two cheap calls than one that poisons the context.
Three implementation details worth stealing
1. A protobuf oneof bug that silently ate zeros
Cloud Monitoring points hold a TypedValue, a protobuf oneof that could be a double, an int64, a bool, or a distribution. My first version tried each field and took the first truthy one.
That code is wrong in a way tests rarely catch: a legitimate value of **0** is falsy. A dead-letter queue at depth zero, an error rate of zero, a request count of zero during an outage — every one of those reads as “no data.” The most important measurement in an incident is often exactly zero.
The fix is to ask the protobuf which field is actually set:
pb = p.value._pb if hasattr(p.value, "_pb") else p.value
kind = pb.WhichOneof("value")
if kind == "distribution_value":
    v = {"count": p.value.distribution_value.count,
         "mean": p.value.distribution_value.mean}
elif kind:
    v = getattr(p.value, kind)
else:
    v = None
Related, from the same family of proto gotchas: in proto-plus, some fields you’d expect to be wrapper types are plain Python booleans. I wrote p.enabled.value for alert policies — reasonable if you know protobuf wrapper types, wrong here, and it crashed the tool. When you’re wrapping a proto API, check the actual runtime type instead of reasoning from the proto docs.
2. Cost recommenders need location discovery
Cloud cost recommenders are per-location. To find idle disks you must ask each zone; to find overprovisioned SQL instances you must ask each region. There’s no “everywhere” parent. Naively iterating all ~40 regions and ~120 zones across 8 recommenders is a thousand API calls, nearly all returning empty.
Instead I use Asset Inventory to find the locations that actually contain cost-relevant resources, and fan out only there:
def _discover_locations() -> list[str]:
    """Find zones/regions where the project has cost-relevant resources."""
    locations: set[str] = set()
    client = get_asset_client()
    results = client.search_all_resources(request={
        "scope": f"projects/{require_project()}",
        "asset_types": _LOCATION_ASSET_TYPES,
        "page_size": 500,
    })
    for r in results:
        loc = getattr(r, "location", "") or ""
        if not loc or loc == "global":
            continue
        locations.add(loc)
        region = _region_of(loc)   # us-central1-a -> us-central1
        if region:
            locations.add(region)
    return sorted(locations)
Then the fan-out treats missing recommenders as normal rather than exceptional, since not every recommender API is enabled in every project:
except (NotFound, PermissionDenied, GoogleAPICallError):
    skipped += 1
    continue
The response reports skipped_calls alongside the findings. That number is the honest signal: a high skip count means “I couldn’t look there,” not “there’s nothing there,” and the agent can say so instead of reporting a clean bill of health it didn’t earn.
One sign convention to watch: the Recommender API expresses savings as a negative cost delta. A $200/month saving arrives as -200. Sorting ascending puts the biggest wins first, and the total gets flipped once at the boundary:
"estimated_monthly_savings": round(-total_savings, 2),3. Parameterized SQL with a column whitelist
The cost-breakdown tool queries a BigQuery billing export, grouped by a dimension the model chooses. SQL column identifiers cannot be bound as query parameters — so a naive implementation interpolates model-supplied text into SQL, which is prompt injection with a database attached.
The answer is a whitelist for the identifier and real parameters for the values:
_GROUP_BY_COLUMNS = {
    "service": "service.description",
    "sku": "sku.description",
    "project": "project.id",
    "region": "location.region",
}
column = _GROUP_BY_COLUMNS.get(group_by.lower())
if column is None:
return {"status": "invalid_argument",
"message": f"group_by must be one of {sorted(_GROUP_BY_COLUMNS)}"}# ... column is now a constant from my own source, not model output
job_config = bigquery.QueryJobConfig(query_parameters=[
bigquery.ScalarQueryParameter("days", "INT64", days),
bigquery.ScalarQueryParameter("limit", "INT64", limit),
])The rule generalizes past this one tool: anything from the model is untrusted input. Not because the model is adversarial, but because the model’s input includes log messages, error strings, and resource labels — text written by systems and people you don’t control. Treat model-chosen identifiers as an enum lookup, never as a string to concatenate.
Notice too that an unconfigured export returns a structured status: not_configured with instructions rather than raising. Errors are part of the tool’s contract; a model reads a clear message and adapts, where a stack trace just derails it.
What it feels like to use
Registering it with an MCP client is one config block pointing at the console script:
{
  "mcpServers": {
    "platform-mcp": {
      "command": "/absolute/path/to/platform-mcp/.venv/bin/platform-mcp",
      "env": {
        "GCP_PROJECT": "YOUR_PROJECT_ID",
        "IMPERSONATE_SERVICE_ACCOUNT": "platform-mcp-ro@YOUR_PROJECT_ID.iam.gserviceaccount.com"
      }
    }
  }
}
Then the interesting shift happens. You stop asking for data and start asking questions.
“What are the top error groups in the last 24 hours, and which one is newest?”
The agent calls list_error_groups, sorts by count, notices one group whose first_seen is four hours ago rather than four months, and calls query_logs with a filter narrowed to that service to pull the surrounding entries. Two tools, one answer, no browser tabs.
“Which node pools look over-provisioned? Show mean CPU against machine type.”
It calls list_gke_clusters for the inventory, query_metric with a MEAN aligner for utilization, and joins them — inventory from one API, telemetry from another, correlated in a way no single console view offers.
“Where can I reduce spend here?”
list_cost_recommendations fans out across discovered locations, get_cost_breakdown gives the shape of current spend, and the agent reconciles the two: here’s what you’re spending, here’s what the recommenders think you could stop spending.
That last one is where read-only stops feeling like a limitation. The agent produces a plan. I decide whether to run it. The division of labor — model does the correlating, human does the mutating — turns out to be the right one far more often than it’s a constraint.
What I’d do differently, and what’s next
Honest limitations. It’s single-project and stdio-only, so it runs on my machine as my identity. Time windows are coarse where the upstream API is coarse — Error Reporting snaps to fixed periods (1h, 6h, 1d, 1w, 30d), so hours=13 becomes a one-day window, and the tool docstring says so plainly rather than pretending to precision it doesn’t have. And there’s no cross-tool correlation logic in the server: joining a log spike to a deploy is the model’s job, and the model is sometimes confidently wrong about causation.
What I’d change. I’d add the metric-type discovery tool first. The single biggest failure mode is the model guessing a metric type that doesn’t exist and getting an empty series back, which reads identically to “the metric is zero.” A list_metric_descriptors tool would fix that whole class of dead end — and the general principle is that a tool that returns nothing must be distinguishable from a tool that found nothing.
What’s next. HTTP transport so a team can share one deployment. Then, maybe, a small set of remediation actions behind a real approval gate — which is a genuinely different project with a genuinely different threat model, and the reason I’m glad I built the read-only version first.
The takeaway
The interesting thing I learned is that most of the engineering in an MCP server isn’t the protocol. FastMCP handles the protocol in about ten lines. The engineering is in three places:
- Tool descriptions are the interface. Your docstrings are the API contract with a model that has no ability to read your source. Write examples in them. Iterate on them the way you’d iterate on a UI.
- Payload shaping is a correctness concern, not an optimization. Return the five fields that matter. A model given everything performs worse than a model given the right thing, and it costs more.
- Capability boundaries belong in infrastructure, not code. “My server never calls a write API” is a comment. “This credential has viewer roles” is a guarantee. Build the second one.
The code is MIT-licensed and on GitHub as platform-mcp if you want to point it at your own project. It’s about 700 lines. The one-time cloud setup is enabling seven APIs and creating one service account.
Fifteen tools, zero of which can break anything. For a first hire, that turned out to be the whole point.
Also published on Medium.
Ask the archive
Got a question about this or anything else here? Ask, and get the passage that answers it — from all 97 posts, in your browser.