Linux Headers — Building a System Performance Monitor in C with Real-Time Progress Bars
Monitoring system performance is crucial for diagnosing issues, optimizing resource usage, and ensuring smooth operations. In this article…
Monitoring system performance is crucial for diagnosing issues, optimizing resource usage, and ensuring smooth operations. In this article, we’ll create a simple utility program in C that tracks CPU, memory, and disk usage in real-time, displaying the data as colored progress bars in the terminal. We’ll leverage Linux headers for accessing system information and use ANSI escape codes for terminal manipulation.
Overview
This utility program will:
- Monitor CPU, memory, and disk usage.
- Display usage data as progress bars in the terminal.
- Use colors (green, yellow, red) to indicate low, medium, and high usage levels.
Features:
- CPU Usage Monitoring: Shows the CPU usage as a percentage and updates dynamically.
- Memory Usage Monitoring: Displays current memory usage.
- Disk Usage Monitoring: Shows disk space usage for the root directory (
/).
Let’s dive into the implementation!
Getting Started
Prerequisites
To follow along, you’ll need:
- A Linux environment.
- GCC (GNU Compiler Collection) installed.
Understanding Linux Headers
Linux headers are files that provide function declarations, macros, constants, and data structures required to interact with the Linux kernel and system-level services. For this project, we utilize headers like:
<sys/sysinfo.h>: Provides thesysinfofunction, which gathers system statistics, such as uptime, available RAM, and load averages.<sys/statvfs.h>: Contains thestatvfsfunction used to retrieve file system statistics like block size, total blocks, and available blocks.
These headers are essential for accessing kernel-level data to monitor the system’s state and performance.
The Code
Below is the complete code for our system performance monitor:
#include <stdio.h>
#include <stdlib.h>
#include <unistd.h>
#include <sys/sysinfo.h>
#include <sys/statvfs.h>
// Function to print progress bar with color based on usage
void print_progress_bar(double usage) {
    int width = 50;  // Width of the progress bar
    int pos = usage * width;
    // Determine color: Green (low usage), Yellow (medium), Red (high)
    const char *color;
    if (usage < 0.5) {
        color = "\033[32m";  // Green
    } else if (usage < 0.75) {
        color = "\033[33m";  // Yellow
    } else {
        color = "\033[31m";  // Red
    }
    printf("%s[", color);  // Set color
    for (int i = 0; i < width; ++i) {
        if (i < pos) {
            printf("#");
        } else {
            printf(" ");
        }
    }
    printf("]\033[0m %.2f%%\n", usage * 100);  // Reset color
}
// Function to calculate CPU usage
double get_cpu_usage() {
    FILE *file = fopen("/proc/stat", "r");
    if (!file) {
        perror("fopen");
        return 0.0;
    }
    char buffer[256];
    fgets(buffer, sizeof(buffer), file);
    fclose(file);
    unsigned long user, nice, system, idle;
    sscanf(buffer, "cpu %lu %lu %lu %lu", &user, &nice, &system, &idle);
    unsigned long total = user + nice + system + idle;
    unsigned long used = total - idle;
    return (double)used / total;
}
// Function to calculate memory usage
double get_memory_usage() {
    struct sysinfo info;
    if (sysinfo(&info) != 0) {
        perror("sysinfo");
        return 0.0;
    }
    return (double)(info.totalram - info.freeram) / info.totalram;
}
// Function to calculate disk usage for a given path
double get_disk_usage(const char *path) {
    struct statvfs buf;
    if (statvfs(path, &buf) != 0) {
        perror("statvfs");
        return 0.0;
    }
    unsigned long total = buf.f_blocks * buf.f_frsize;
    unsigned long used = total - (buf.f_bfree * buf.f_frsize);
    return (double)used / total;
}
int main() {
    while (1) {
        printf("\033[H\033[J");  // Clear the screen and move the cursor to the top
        printf("--- System Performance Monitor ---\n");
        // CPU usage
        printf("CPU Usage: ");
        double cpu_usage = get_cpu_usage();
        print_progress_bar(cpu_usage);
        // Memory usage
        printf("Memory Usage: ");
        double memory_usage = get_memory_usage();
        print_progress_bar(memory_usage);
        // Disk usage
        printf("Disk Usage: ");
        double disk_usage = get_disk_usage("/");
        print_progress_bar(disk_usage);
        sleep(1);  // Refresh every second
    }
    return 0;
}
Important Functions Explained
CPU Usage Calculation:
- Reads data from
/proc/stat, which provides system statistics since boot, including CPU time spent in various modes (user, system, idle). - Calculates the CPU usage percentage by comparing the total time to the idle time.
Memory Usage Calculation:
- Utilizes the
sysinfo()function from<sys/sysinfo.h>to obtain system memory details. - Calculates the memory usage percentage by comparing free and total RAM.
Disk Usage Calculation:
- Uses the
statvfs()function from<sys/statvfs.h>to retrieve file system statistics for the specified path. - Calculates disk usage as the proportion of used blocks to total blocks.
Displaying Progress Bars:
- The
print_progress_bar()function visualizes usage data as a progress bar. - Uses ANSI escape codes to dynamically change colors:
- Green for low usage (< 50%).
- Yellow for medium usage (50–75%).
- Red for high usage (> 75%).
- The escape code
\033[H\033[Jclears the terminal screen and moves the cursor to the top to refresh the display seamlessly.
Running the Program
Compile the Code:
gcc -o monitor monitor.cRun the Program:
./monitor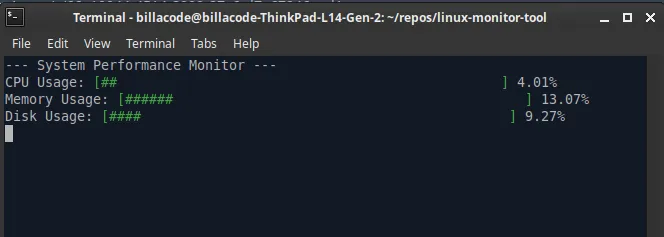
Conclusion
Creating a system performance monitor in C provides a hands-on approach to learning about Linux headers and system programming. This project showcases how to interact with low-level system data and visualize it effectively with terminal graphics. It’s an excellent exercise for anyone interested in systems programming or performance optimization.
Give it a try and explore how you can extend this basic monitor with additional features or customizations! Happy coding :P
Also published on Medium.
Ask the archive
Got a question about this or anything else here? Ask, and get the passage that answers it — from all 97 posts, in your browser.